
This is an archived site. This site is no longer being maintained or reviewed for broken links.
Down to the Sea for Science—Science Features
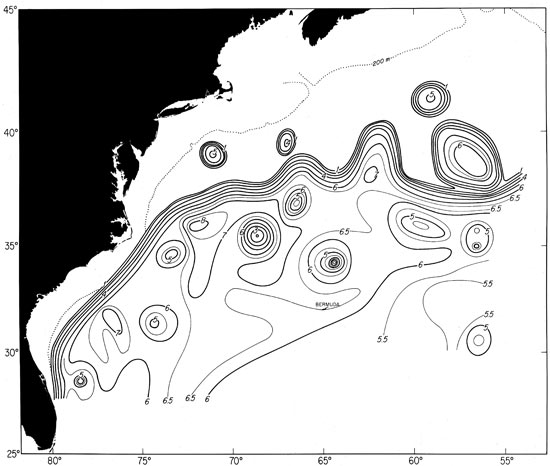
This chart of 1975 hydrographic and satellite data shows the path of the Gulf Stream and a number of warm-core and cold-core rings (north and south of the stream, respectively) that have spun off it. This was the first attempt to create a “weather map” for the northwestern Atlantic Ocean. The flow is charted using the depth (in hundreds of meters) of a water layer registering 59°F (15°C), which years of research have shown to be a reliable indicator of the surface current. (Figure courtesy of Phil Richardson) [back]
|